Introduction
The Eurasian Economic Union (EAEU) was established with the signing of an agreement between five countries – Armenia, Belarus, Kazakhstan, Kyrgyzstan, and Russia – in the Commonwealth of Independent States (CIS) on 29 May 2014. The agreement came into force at the beginning of 2015. Following the six years since its establishment, this article assesses the initial impact of deep economic integration on foreign direct investment (FDI) in the EAEU countries. Deep economic integration refers not only to the simplification of trade procedures but also to the free movement of services, capital, and labour among the EAEU countries. In addition, deep integration implies elements of a common economic policy. Therefore an intensive movement of productive capital in the form of FDI being expected as one of the results of regional liberalization.
The EAEU is an economic union with a pronounced imbalance in the level of economic development and the political influence of its member states. Russia has a dominant position among the EAEU countries as it accounts for 86.38 per cent of the EAEU’s gross domestic product (GDP) 1. Russia also has the highest GDP per capita in the EAEU region, amounting to $11,606 2 in 2019, followed by Kazakhstan ($9,793) and Belarus ($6,674), whereas Armenia and Kyrgyzstan have the lowest GDP per capita ($4,623 and $1,318, respectively).
The literature on the EAEU is mostly devoted to assessments of and outlooks on its development (Vinokurov, 2017; Shadrina, 2019, etc.) and/or peculiarities of its legal and institutional aspects (Aseeva & Gorski, 2021); however, some works have studied intraregional FDI flows, FDI determinants, and FDI policy issues (Akhmetzaki & Mukhamediyev, 2017; Kostyunina, 2021).
This article analyses the participation of the EAEU countries in the global economy by assessing the recent developments in FDI inflows and stock, measuring the intraregional flows, and identifying the peculiarities of FDI policies, with the aim to find differences and similarities among the member states.
FDI Dynamics and the Economic Development of the EAEU Countries
During the last two decades, FDI inflows in the EAEU countries had been growing up until 2014, when the trajectory reversed (figure 1). The main reasons for the decrease in FDI inflows were Western sanctions against Russia in 2014, subsequent devaluation of the Russian rouble and the currencies of the EAEU countries, divestments (sales of foreign affiliates to investors from a host country or liquidation of an affiliate), and de-offshoring of multinational enterprises (MNEs) of Russian origin due to a policy aim of the Russian government since 2012 (WIR 2019b, p. 56). At the same time, the privatization programmes in Kazakhstan (WIR, 2016) and in Russia (EADB, 2017) as well as the newly established special economic zones (SEZs) in every EAEU country have positively influenced the inward FDI flows to the countries.
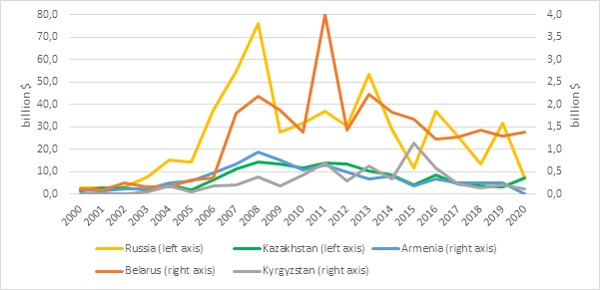
Figure 1. Dynamics of FDI flows in the EAEU, 2000–2020
Source: Author’s elaboration based on UNCTAD data (https://unctad.org/topic/investment/world-investment-report), the Bank of Russia (https://cbr.ru/eng/statistics/macro_itm/svs/), the Central Bank of Armenia (https://www.cba.am/en/sitepages/statexternalsector.aspx), the National Bank of the Republic of Belarus (https://www.nbrb.by), the National Bank of Kazakhstan (https://www.nationalbank.kz/en/news/platezhnyy-balans-vn-sektora), and the National Bank of the Kyrgyz Republic (https://www.nbkr.kg/index1.jsp?item=129&lang=ENG)NG)
In 2020, the distribution of FDI inflows among the EAEU countries was different from the previous years. While Russia, Kyrgyzstan, and Armenia attracted much lower FDI compared to the previous year, foreign direct investors were quite active in Kazakhstan and Belarus. In particular, FDI inflows decreased by 77.3 per cent to $7.2 billion in Russia. This number is slightly lower than FDI inflows in Kazakhstan ($7.265 billion in 2020), where it increased by almost 33 per cent in comparison with the previous year, which could be explained by political stability and proactive FDI policy of Kazakhstan even during the Covid-19 crisis.
The role of FDI in economic development of the EAEU countries could be evaluated by using the following indicators: (a) share of FDI inflows in gross fixed capital formation (GFCF), (b) FDI stock per capita, and (c) share of FDI stock in GDP. In addition, studies on FDI structure will highlight FDI patterns of the EAEU countries’ involvement in international production and globalization.
FDI inflows as a percentage of GFCF has considerably decreased in all EAEU countries since 2017 (figure 2). In fact, during the last two decades, FDI has been an essential financial and productive investment resource for Kyrgyzstan and Kazakhstan, providing in some years more than 50 per cent of total real investment in these countries. Similarly, Armenia has relied on FDI at around 20 per cent during the last two decades. For Russia and Belarus, the share of FDI in GFCF has always been below the average for transition economies and the world, indicating that these two countries are less dependent on foreign direct capital inflows.
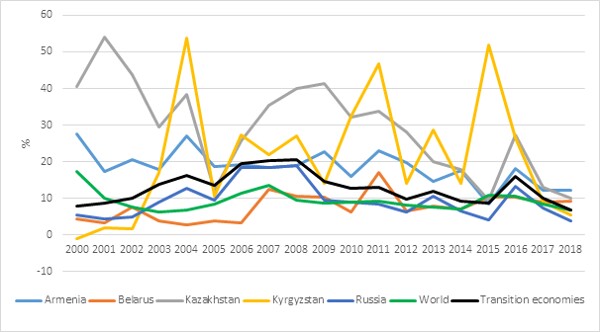
Figure 2. Inward FDI flow as a percentage of GFCF, 2000–2018
Source: Author’s elaboration based on UNCTADstat
Furthermore, the EAEU countries are compared with a group of transition and post-transition countries (28 countries) in the period of 2010 and 2019 to better comprehend their rank as competitors for foreign productive assets. According to FDI stock per capita criteria, Kazakhstan is highly involved in international production via FDI as it takes the position in the top-10 transition countries, even outpacing Croatia and Poland, which are very attractive countries for FDI (figure 3). The position of Russia is somewhat moderate; moreover, the indicator has not grown in the last decade. Armenia, Belarus, and Kyrgyzstan, on the other hand, are in the group of countries lagging behind.
FDI stock is used as a proxy measurement of the level of country’s involvement in international production through internal linkages (subsidiaries, associated direct investment enterprises, and branches) rather than external linkages (franchising, licensing, outsourcing, subcontracting, etc.). The share of FDI stock in the GDP of the country indicates the level of its internationalization, on the one hand, and reveals the level of its dependence on foreign direct capital, on the other hand.
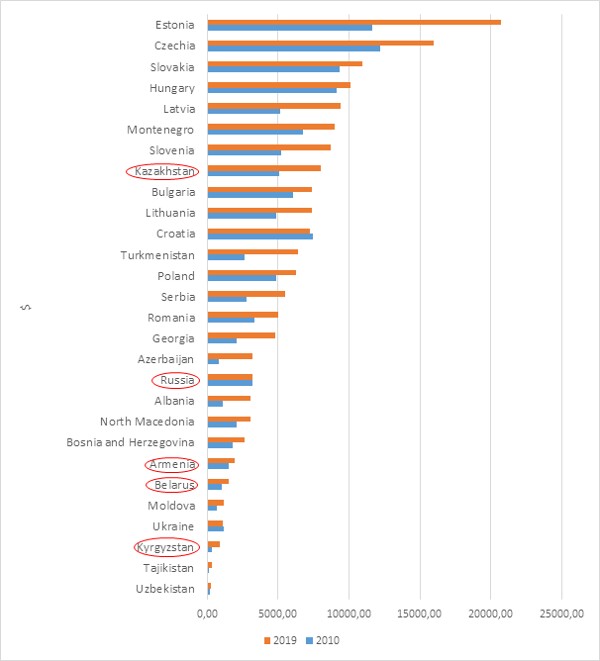
Figure 3. Inward FDI stock per capita of transition and post-transition countries
Source: Author’s elaboration based on UNCTADstat
Inward FDI stock as a percentage of GDP has risen considerably in Kazakhstan and Kyrgyzstan – up to 84 per cent and 66 per cent respectively in the last decade (figure 4). In Russia and Armenia, the indicator decreased slightly to 27.2 per cent and 41.5 per cent respectively. In Belarus, although it has grown from 17 per cent in 2010 to 23 per cent in 2019, it is still lower compared to the groups of post-transition and transition economies. This suggests that for Belarus, Russia, and Armenia there is room for improvement to receive new FDI without jeopardizing the sustainability of the countries in terms of foreign direct capital dependence.
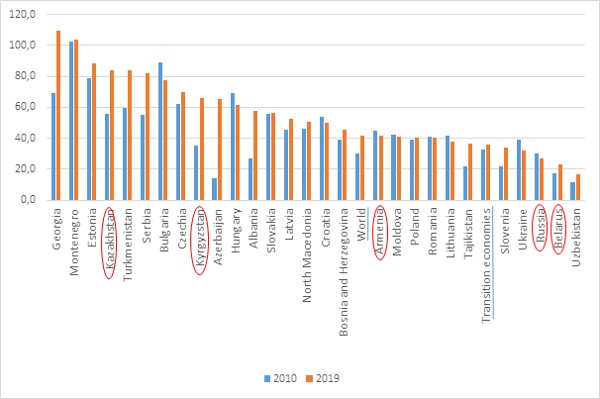
Figure 4. Inward FDI stock as a percentage of GDP
Source: Author’s elaboration based on UNCTADstat
The Geographical and Industrial Structure of FDI in the EAEU Countries
In terms of absolute numbers, the intraregional FDI stock has been growing in the EAEU countries, although the growth was neither impressive nor steady (table 1). Since the EAEU treaty came into force, around $18.1 billion FDI stock was accumulated by the end of 2015 and was almost on the same level of $18.9 billion in 2019. The evaluation of the share of intraregional FDI stock in total FDI stock in the EAEU confirms the downsizing role of this type of deep integration as a trigger of regional productive assets creation (table 1). Russian companies made key investments in the region when they began their foreign expansion and then followed global investment strategies, thus prioritizing a “going global” vision rather than “going regional” (EADB, 2016).
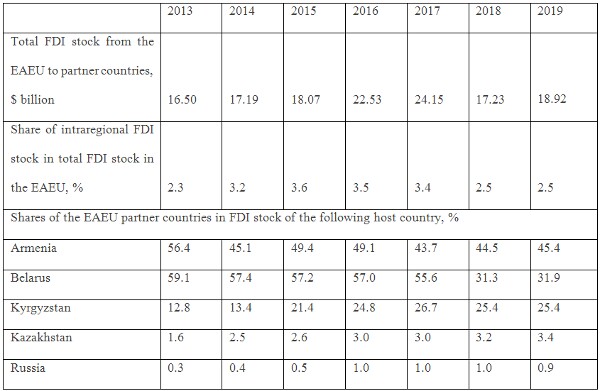
Table 1. Role of intraregional FDI stock in the EAEU and member states, 2013–2019
Source: Author’s elaboration based on Investment Map data (https://www.investmentmap.org)_
However, during 2013–2019, the importance of FDI from the EAEU partners almost doubled for Kyrgyzstan and Kazakhstan and tripled for Russia. In the case of Belarus and Armenia, FDI from the EAEU was dominating in 2013 but decreased radically by 2019.
By 2019, Russia, surpassing Kazakhstan and Belarus, was the largest recipient of FDI from the EAEU partners (table 2). The pairs Russia-Kazakhstan and Russia-Belarus experienced the most intensive bilateral flows of mutual FDI.
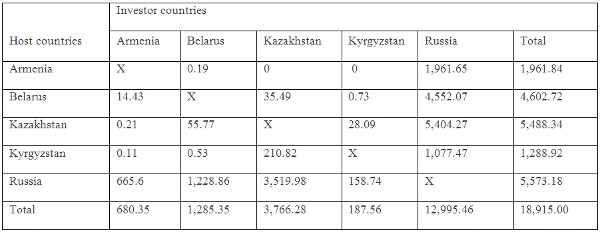
Table 2. Mutual FDI stock in the EAEU member states, 2019
Source: Author’s elaboration based on Investment Map data (https://www.investmentmap.org)_
Geographical distribution of inward FDI stock in the EAEU countries shows one distinct similarity – very high concentration (table 3). Indeed, the top-10 investor countries represent around 83–94 per cent of FDI inward stock in each EAEU member state.
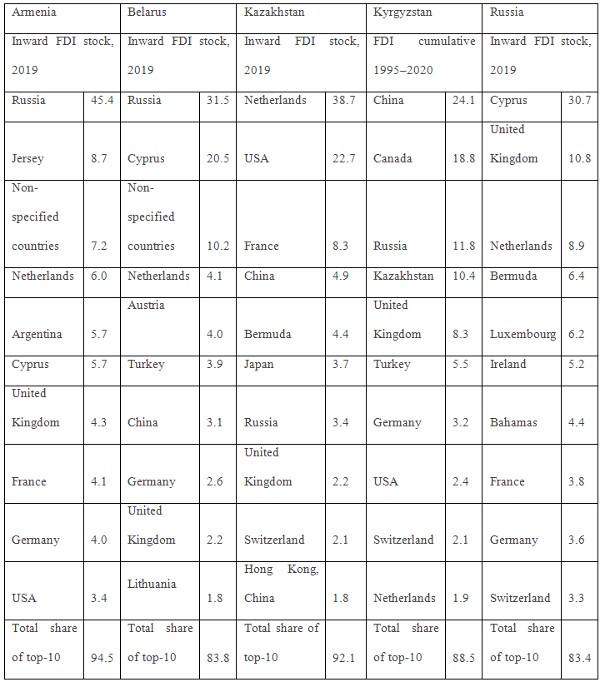
Table 3. Geographical distribution of inward FDI stock by main source countries
Source: Author’s elaboration based on Investment Map data for Kazakhstan and Russia (https://www.investmentmap.org), on the Statistical Committee of the Republic of Armenia (https://www.armstat.am/en/?nid=14), on the National Statistical Committee of Kyrgyz Republic (http://www.stat.kg/en/statistics/investicii/), and on the International Investment Position data taken from the National Bank of the Republic of Belarus (https://www.nbrb.by)_
In general, the geographical structure of inward FDI stock reveals the different stories of the EAEU countries’ involvement in globalization, although some similarities may appear within the group. First, transshipping and round-tripping FDI can be distinctly observed in all countries except Kyrgyzstan. Moreover, traditional offshore countries comprise around 50 per cent of FDI stock in Russia. This peculiarity has been justified in a number of studies (e.g. Kalotay, Éltető, Sass, and Weiner, 2014; Liuhto, Sutyrin, and J.-V. F. Blanchard, 2017). Second, a long-term neighbourhood effect has taken place in small EAEU member states. Especially in Armenia and Belarus, there is a significant presence of Russian business. Third, traditional global leaders as a source of FDI – the Netherlands and the UK – are very active investors in all EAEU countries. Germany is equally visible in all countries except Kazakhstan. Fourth, Armenia stands apart owing to a pattern of diaspora-driven FDI. Tierras de Armenia (wine production under the Karas label since 2006) is an investment by an Armenian-Argentinian diaspora and a classic example of committed diaspora investment (UNCTAD, 2019a). Fifth, China actively invested in all the EAEU countries in the last decade due to the country taking on a global leadership role, however with the following exceptions and challenges:
- Chinese investment in Armenia is negligible;
- Chinese share in the FDI stock of Kazakhstan has been decreasing due to divestments for the last seven years, which became the largest in 2020 (more than $0.8 billion).3 This can be partly explained by the fact that the people in Kazakhstan (as well as in Kyrgyzstan) do not welcome Chinese investment. 4 In addition, the cooperation under the framework of the Belt and Road Initiative (BRI) has subsided. Thus, under the bilateral agreement of 2016 about 55 Chinese plants and factories were to be moved to the western part of Kazakhstan. Nevertheless, at the end of 2019 only several projects had been completed. 5
- A considerable reduction of Chinese FDI can also observed in Belarus 6 and Kyrgyzstan 7 in 2020 due to political instability following elections and the resulting tension in both countries, which forced Chinese businesses to follow a wait-and-see strategy.
The industrial structure analysis is interesting because it might shed a light on the role of FDI in a host country as a development engine via integration into the country’s economic system. For this purpose, it is appropriate to employ the classification of FDI according to a MNE strategy criteria based on four types: efficiency seeking, resource seeking, market seeking, and strategic assets seeking (Dunning & Lundan, 2008). Efficiency-seeking FDI is a source of new competitors on the market, thus it may foster productivity and competitiveness of entire industries not only on local but also external markets. Usually, this type of FDI flows to the manufacturing sector, where it is possible to establish backward and forward linkages with local business. The latter helps foreign-owned companies to integrate into the economy of a host country and therefore to act as a driver of economic growth and development. However, the opposite, so-called enclave effect is also possible when FDI activities are only concentrated in SEZs, lacking interaction with the entire domestic economy of the host country. This type of FDI is often associated with boosting exports via the integration of the country into global or regional value chains.
Resource-seeking FDI is also able to implement exports strategies, although the level of integration into the local economy is very low. Market-seeking FDI is implemented for increasing sales in host countries, such as infrastructure, banking and insurance, telecommunications, retail, real estate activities, etc. New market-seeking foreign companies may crowd out local businesses, which is always difficult for a developing economy. Market-oriented FDI is accompanied by a substantial outflow of repatriated earnings and may result in pressure on the balance of payments of a host country. The last type of FDI is strategic assets seeking, which mostly focus on the purchase of competitive assets.
FDI oriented towards resource and efficiency seeking is very often export driven rather than import substituting. International practice shows that in order to drive economic growth and steady development, the economy should use a diversified approach for attracting all types of FDI and create an innovative and competitive environment to maximize positive FDI effects in a host economy (Petrushkevich, 2016).
A sectoral analysis of FDI in the EAEU countries reveals different patterns; however, the following similarities have been identified (table 4).
There is low FDI diversification among industries. In all countries, top-10 industries comprise more than half of inward FDI stock. For Kazakhstan and Kyrgyzstan, the concentration is even higher, around 90 per cent. Manufacturing is less attractive for foreign investors in all countries. In Armenia, the majority of FDI is accumulated in infrastructure. In Belarus, the majority is in infrastructure and services mostly for the local market. In Kazakhstan, almost 80 per cent of FDI is in extractive industries. In Russia, more than half of FDI stock are in services for the local market.
In Kyrgyzstan, manufacturing occupies more than 38 per cent of accumulated inward FDI. Although the sector was not detailed further, there were doubts that it implies manufacturing goods industries. The case analysis showed that it is actually primary goods production from extracting industries. For instance, Canadian FDI comprises around 19 per cent (table 3) and has been invested in mining, which contradicts the 5 per cent share indicated in table 4. In fact, the Canadian company Centerra Gold Inc. is one of several investors focusing on mining in Kyrgyzstan; however, it is the largest and most influential investor, which has been operating through its subsidiary Kumtor Gold Company CJSC since 1997. The share of the company in Kyrgyzstan’s GDP was 12.5 per cent in 2020, and it accounted for 23.3 per cent of the country’s industrial output. 8
Thus, in the EAEU countries two FDI patterns can be specified: resource based, export driven (in Kazakhstan and Kyrgyzstan) and market oriented (in Russia, Belarus, and Armenia). There is lack of FDI oriented towards efficiency seeking and strategic assets, which indicates a low level of the countries’ involvement in international production and a lack of competitive companies for mergers and acquisitions.
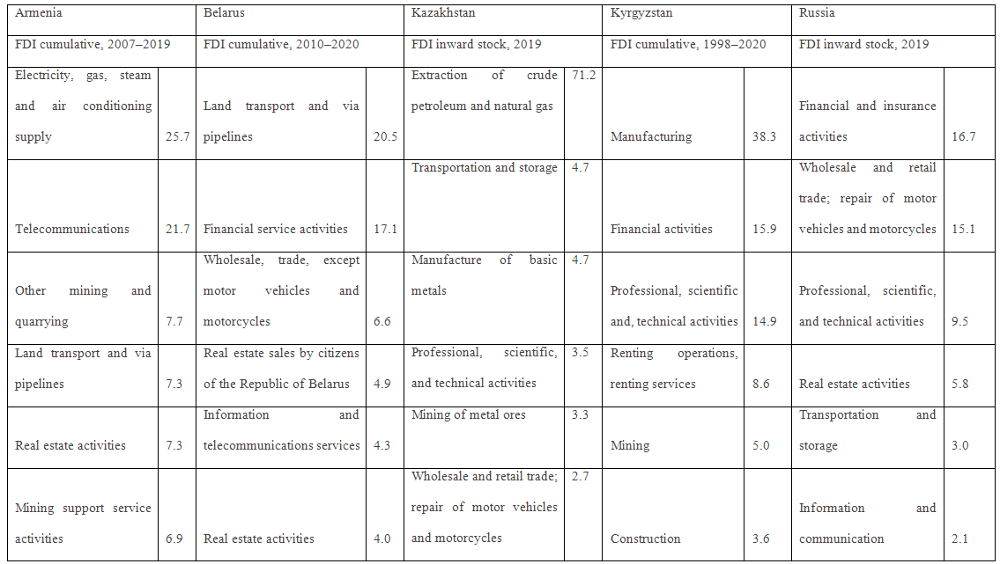
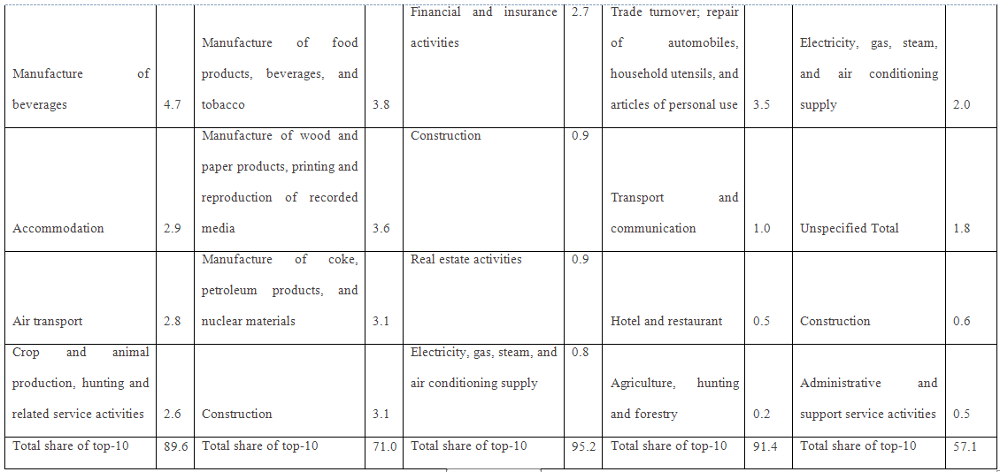
Table 4. Distribution of inward stock FDI by industries, %
Source: Author’s elaboration based on Investment Map data for Kazakhstan and Russia (https://www.investmentmap.org), on the Statistical Committee of the Republic of Armenia (https://www.armstat.am/en/?nid=14), on the National Statistical Committee of Kyrgyz Republic (http://www.stat.kg/en/statistics/investicii/), and on the Republic of Belarus (https://www.belstat.gov.by/)
FDI Policy in the EAEU Countries: A Passive Approach
In terms of FDI policy, various patterns can be observed in the EAEU countries. General assessments shows that FDI policy is only proactive in Kazakhstan; in the other EAEU member states, it is passive. Indeed, the legislation has been agreed upon, the prioritized sectors have been defined (e.g. in Kyrgyzstan it is agriculture, textile, hydro energy, and tourism), and the relevant sites for initial information have been designed.
All of the EAEU countries have established several SEZs with an attractive package of tax incentives for a broad list of spheres of production. The number of SEZs in Russia in 2019 was 130, Kazakhstan 10, Belarus 7, Armenia 4 (WIR, 2019b, p. 183), and Kyrgyzstan 5. 9 At the same time, the role of SEZs is different in the EAEU countries. For Russia, for instance, it is fair to qualify its FDI policy as SEZ focused because it is the central instrument for FDI promotion.
Investment promotion agencies (IPAs) – which in the contemporary global economy are the major channels for FDI to a host country – in Russia, Belarus, and Kyrgyzstan play quite a limited role. The functions are rather traditional than creative as well as are limited (information supply, meetings arrangements, entry support, and/or interactions with regional authorities). In the cases of the Russian Investment Agency “Invest in Russia” 10 and Kyrgyz Investment Promotion and Protection Agency 11 the provided information is often scarce or outdated. In this regard, the Belarusian National Agency of Investment and Privatization 12 is quite informative. In Armenia, its investment promotion agency was abolished in 2019 (UNCTAD, 2019a), which deprives the country of a critically important mechanism within its FDI policy.
FDI policy in Kazakhstan is different from the other EAEU partners. Quite active direct investment flows into the Kazakh economy; even in 2020, the country benefited from not only its strategic position, political neutrality, and natural resources, but also the proactive instruments used by the government in attracting investments. FDI policy comprises a system of consistent long-term measures towards investment climate improvement as well as selective targeting, financial support, tax incentives, and aftercare services.
Like in most successful host countries, an investment promotion agency (Kazakh Invest NC JSC) is directly under the control of the prime minister. It consists of a well-organized structure, central headquarters, and a wide network of regional and overseas representatives with integral functions. To justify its transparency and effectiveness, Kazakh Invest issues annual reports on activities and finances. 13 What is of utmost importance about Kazakhstan, it has established an investment ombudsman that provides additional protection for foreign direct capital in the country.
Conclusions
In general, the EAEU countries are heterogeneous in all aspects of their economic development, including FDI patterns. However, some similarities have been found in a high concentration of FDI sources, low diversification of FDI stock by industries, and passive type of FDI policy, which show underutilized opportunities of the EAEU’s involvement in the global economy via international production. Kazakhstan contrasts with other member states in terms of the significant role FDI has played in economic development and its aspiration to diversify its economy by employing a proactive FDI policy.
The low level of intraregional FDI demonstrates that the integration factor has generally not become a driver of mutual FDI. Therefore, the following policy recommendations could be appropriate:
- the intraregional FDI strategy should be elaborated jointly by the EAEU countries (with Russia and Kazakhstan acting as technical and financial leaders);
- an annual road map should be designed with a focus on FDI facilitation and the development of dynamic competitive advantages in the EAEU;
- strategic projects with multiple investment outcomes for the countries’ economic growth must be identified;
- a common strategy on the inclusion of BRI into the EAEU investment policy needs to be elaborated upon; and
- institutional assistance for the internationalization of EAEU companies should be arranged at the national level.
Notes:
1 Authors calculations of the data on UNCTADstat. Retrieved from https://unctadstat.unctad.org/wds
2 UNCTADstat. Retrieved from https://unctadstat.unctad.org/wds
3 National Bank of Kazakhstan. Retrieved from https://nationalbank.kz/en/news/platezhnyy-balans-vn-sektora
4 Zyenko, I. (2020) Anti-Chinese protests in the Post-Soviet Space. Russia in global affairs. No 6. [Зуенко, И. (2020). Антикитайские протесты на постсоветстком пространстве. Россия в глобальной политике. No. 6]. Retrieved from https://globalaffairs.ru/articles/antikitajskie-protesty-postsovet/
5 Forbes Kazakhstan. Retrieved from https://forbes.kz/process/economy/55_kitayskih_zavoda_forbeskz_obyyasnyaet_pochemu_v_kazahstane_etih_predpriyatiy_ne_poyavitsya/
6 Ministry of Economy in the Republic of Belarus. Retrieved from https://www.economy.gov.by/ru/pezultat-ru/
7 National Statistical Committee of Kyrgyz Republic. Retrieved from http://www.stat.kg/en/statistics/investicii/
8 Kumtor Gold Company CJSC. Retrieved from https://www.kumtor.kg/wp-content/uploads/2021/03/kgc_news_release_mar_12_2021_q4_end-of-2021_ru-1.pdf
9 Investment portal Kyrgyz Republic. Retrieved from https://invest.gov.kg/free-economic-zones/
10 Russian Investment Agency. Retrieved from http://investment-in-russia.com/en/
11 Invest in Kyrgyz Republic. Retrieved from https://invest.gov.kg/
12 National Agency of Investment and Privatization. Retrieved from https://investinbelarus.by/en/
13 Kazakh Invest. Retrieved from https://invest.gov.kz/about-us/corporate-governance/reports-and-plans/